To help implement and maintain a robust UI, ACE provides the optional ACE Debugger and Debug Bar.
ACE Debugger tests a range of ACE implementation errors and some key HTML errors such as duplicate IDs or missing ALT text on images. The tool is designed to catch common errors which we have seen regularly in real world development. It complements but does not replace other code quality tools.
Debugging in the browser
The simplest way to use the Debugger is with the standalone bookmarklet in your web browser. Simply drag the button below into your bookmarks bar and then click it to add the debugger to the page you're viewing (or manually create a bookmarklet using the link below).
New Feature! ACE Debuggerdrag this onto your bookmarks bar!
Note you may need to accept security warnings in some browsers the first time you run this bookmarklet.
Debugging in your dev environment
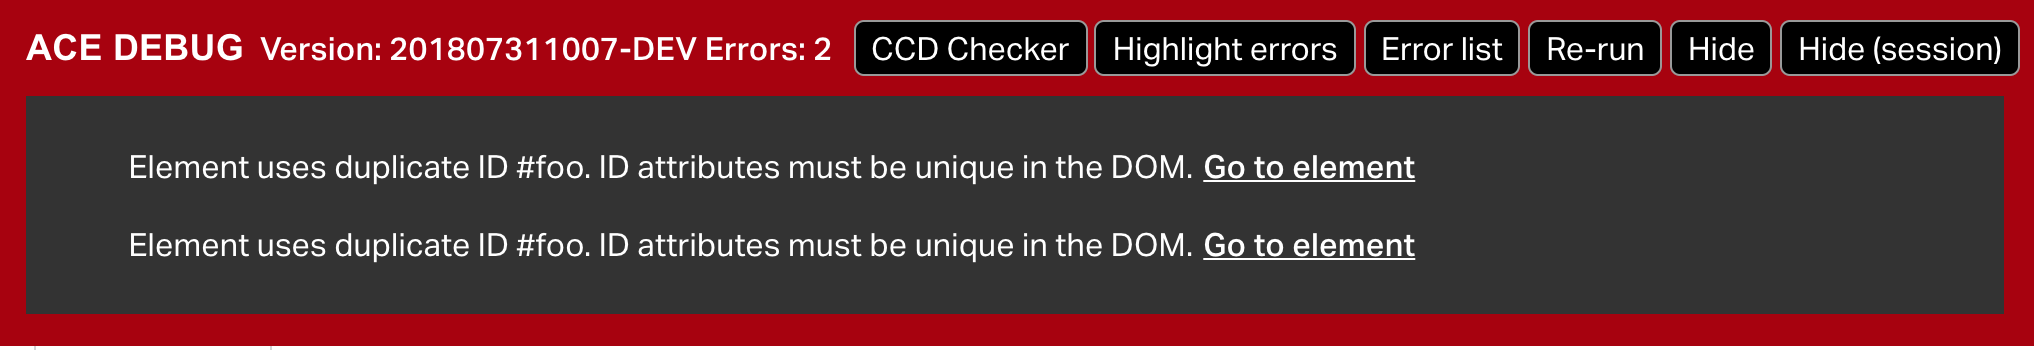
For ongoing projects it is recommended that you run the Debugger automatically in your development and testing environments. This will show the debug bar at all times, confirming that the tool has been run.

It will show bright red when an error has been detected. There are controls to highlight errors, re-run the debugger or hide the bar (eg. to present a demo).
When you get errors, the best place to begin is with a review of the full error list.
Where possible there will be a jump link to take you to the affected element; otherwise there will be a message describing how to locate the element that triggered the error. The debugger can highlight problem elements so long as they remain visible in the page:
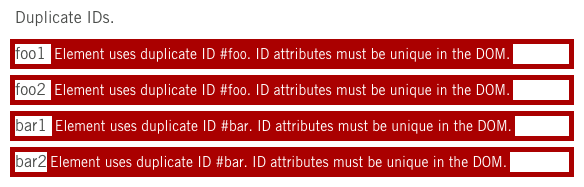
Invisible elements will still have an error ID applied to them, so you can inspect generated source and search for the ID.
Note that some errors will show more than once - for example all instances of duplicate IDs will generate an error.
Fixing one error may expose or create a related error, so always re-run the debugger after making changes. A common example is fixing a duplicate ID on a form input, which subsequently throws a missing label error if the label wasn't updated to match.
ID template strings
In some cases the markup will need to include templates with string replacement markers for the ID. To avoid throwing spurious duplicate ID errors, the debugger will ignore IDs wrapped in double square or curly braces:
                                    <span id="prefix_[[template]]"></span>
                                    <span id="prefix_{{template}}"></span>
Enable the debug bar
The debugger must be loaded, initialised and run once the DOM has been rendered and all DOM scripting is complete.
In virtual DOM applications, note the Debugger requires jQuery and it will need to be run again after each render cycle. It inspects the browser DOM, not the virtual DOM.
Load the following resource in the HEAD:
<link rel="stylesheet" href="dist/debug/ace-debug.css" media="all">Load the JavaScript as late as possible in the document (must be called after jQuery, ACE and all other DOM scripts):
                                    <script src="dist/debug/ace-debug.js"></script>
                                    <script>
                                    (function(ACEDEBUG){
                                      // setTimeout 0 used to help ensure debugger executes after other JS
                                      setTimeout(function() {
                                        // required: init and run the debugger
                                        ACEDEBUG.init();
                                        ACEDEBUG.debug($('html'));
                                        // optional: automatically highlight errors inline
                                        ACEDEBUG.highlightErrors();
                                      },0);
                                    })(window.ACEDEBUG);
                                    </script>
It is highly recommended that you only load the debugger resources in dev and test environments. If there is any chance of the debugger leaking into production, add a location check to avoid calling the Debugger in production:
                                    if ( document.location.hostname === 'dataroom.ansarada.dev' ) {
                                      ACEDEBUG.init();
                                      ACEDEBUG.debug();
                                    }
JavaScript methods
The Debugger can be called directly. This does mean it's possible to load the debug resources in an instance and call it manually; or call it from your SPA while it's in dev mode.
| Function | Arguments | Description | Example |
|---|---|---|---|
| init | none | Sets up the debug bar and shows the ready state. Must be run once after the DOM has rendered and before debug is called. |
|
| debug | jQuery element | Runs the debugger. If a context is not set, will walk the full document. Running the debugger clears previous results and shows a fresh error summary. |
|
| checkCCD | none | Toggles in-page highlighting of elements that have data-ansarada-ccd="true". |
|
| highlightErrors | none | Toggles in-page highlighting of errors. |
|
| clearErrors | none | Clears the debug bar. Rarely required but available if programmatically handling the Debug Bar. |
|
Logging results
The debugger writes each error to the browser console, and ACEDEBUG.debug() returns a stringified JSON object with a summary of results. Results are stringified due to some logging tools not being able to consume the object directly.
To use the results:
                                    var results;
                                    ACEDEBUG.init();
                                    results = JSON.parse(ACEDEBUG.debug());
                                    console.log(results.errorCount); // 0 means happy days
Example of results:
                                    {
                                      "url": "http://localhost:8135/tests/debug-test.html",
                                      "timestamp": "1479258410054",
                                      "time": "Wed Nov 16 2016 12:06:50 GMT+1100 (AEDT)",
                                      "browser": "chrome",
                                      "browserVersion": "54.0.2840.98",
                                      "os": "mac",
                                      "aceVersion": "1.30.0",
                                      "errorCount": "1",
                                      "errors": {
                                        "error-1": {
                                          "message": "Element uses duplicate ID #foo. ID attributes must be unique in the DOM.",
                                          "element": "<p id=\"foo\">foo1 </p>",
                                          "hidden": "false" }
                                      },
                                      "exclusionCount": "2"
                                    }
Notes:
- Timestamp is provided in two formats to make life a little easier for humans.
- Browser information is determined via
ACE.browser() aceVersionwill usually be a SemVer number for a production release. In some cases it may contain a dev version like201611150311-DEV, noting these versions should be considered unstable.errorCountwill be0for an error-free page or a positive integer for a page with errors. Remember that this may not reflect the state of an updated DOM, particularly in SPAs. To ensure accuracy, callACEDEBUG.debug()immediately before querying the results.- Each error is self-contained with a timestamp and URL, to enable detailed logging.
- Exclusions are rare and cover some legacy code that could not be changed, plus some doc pages (documenting patterns sometimes requires technically invalid structures). In any new project, exclusions should not appear.
Errors
While most errors are self-explanatory, the following information is for those errors which may need more information.
| Error | How to fix it |
|---|---|
| ACE button groups can only contain ACE buttons. | This is usually triggered by stray elements creeping into a Button Group. Look for custom buttons which do not have ACE classes, or hidden elements which have been returned to the DOM as siblings of an ACE button. |
| Only form sections, form groups and form hidden can be nested inside a form. | This error refers to direct descendents of the form. Look for custom elements, hidden inputs that should be contained in a hidden group, etc. |
| Form groups must not be nested. | Form groups can contain subgroups, but groups cannot be inside other groups. In most cases this is just a templating error, particularly in whitespace-significant templating languages where the nesting level isn't quite as obvious. |
| Error state class must be added to both the form group and the input. | When form inputs are in error state, there is a class both on the input itself and its parent form group. This is to allow styling of the whole group if required. |
| All hidden inputs require the .ace-form-input-hidden class. | In most cases this is triggered when old hidden inputs are present, but do not have the required class or are in the wrong location. Refer to the Forms documentation for details on handling hidden inputs. |
| Any error referring to 'human text'. | This is a way to refer to text provided for accessibility purposes. There must always be some human-readable text available in elements like icons, buttons, labels and legends. If in doubt, refer to the ACE element's documentation for a pattern which will provide examples with human-readable text. |
| Icon and icon parent element both missing accessible text. |
Icons are often used together with another element that provides human-readable text. That means that sometimes icons legitimately have no human text, because they would be duplicating a sibling element's text. When the debugger finds an icon with no text, it will look for a sibling element to see if there is some text in context. Close buttons are a good example:
The icon's logical alt text would be 'Close', however there is a sibling span which already contains that text. Rather than have assistive tech read out 'close close', the icon may omit the text. However, in icon-only buttons, the icon must include the text. |
| Input ID attribute does not match any label FOR attribute. | All form inputs require a label element; and that label must be associated using for="id-of-input". In most cases this error simply means the ID and FOR attributes don't match, or have been omitted.
|